
Monday, November 30, 2020
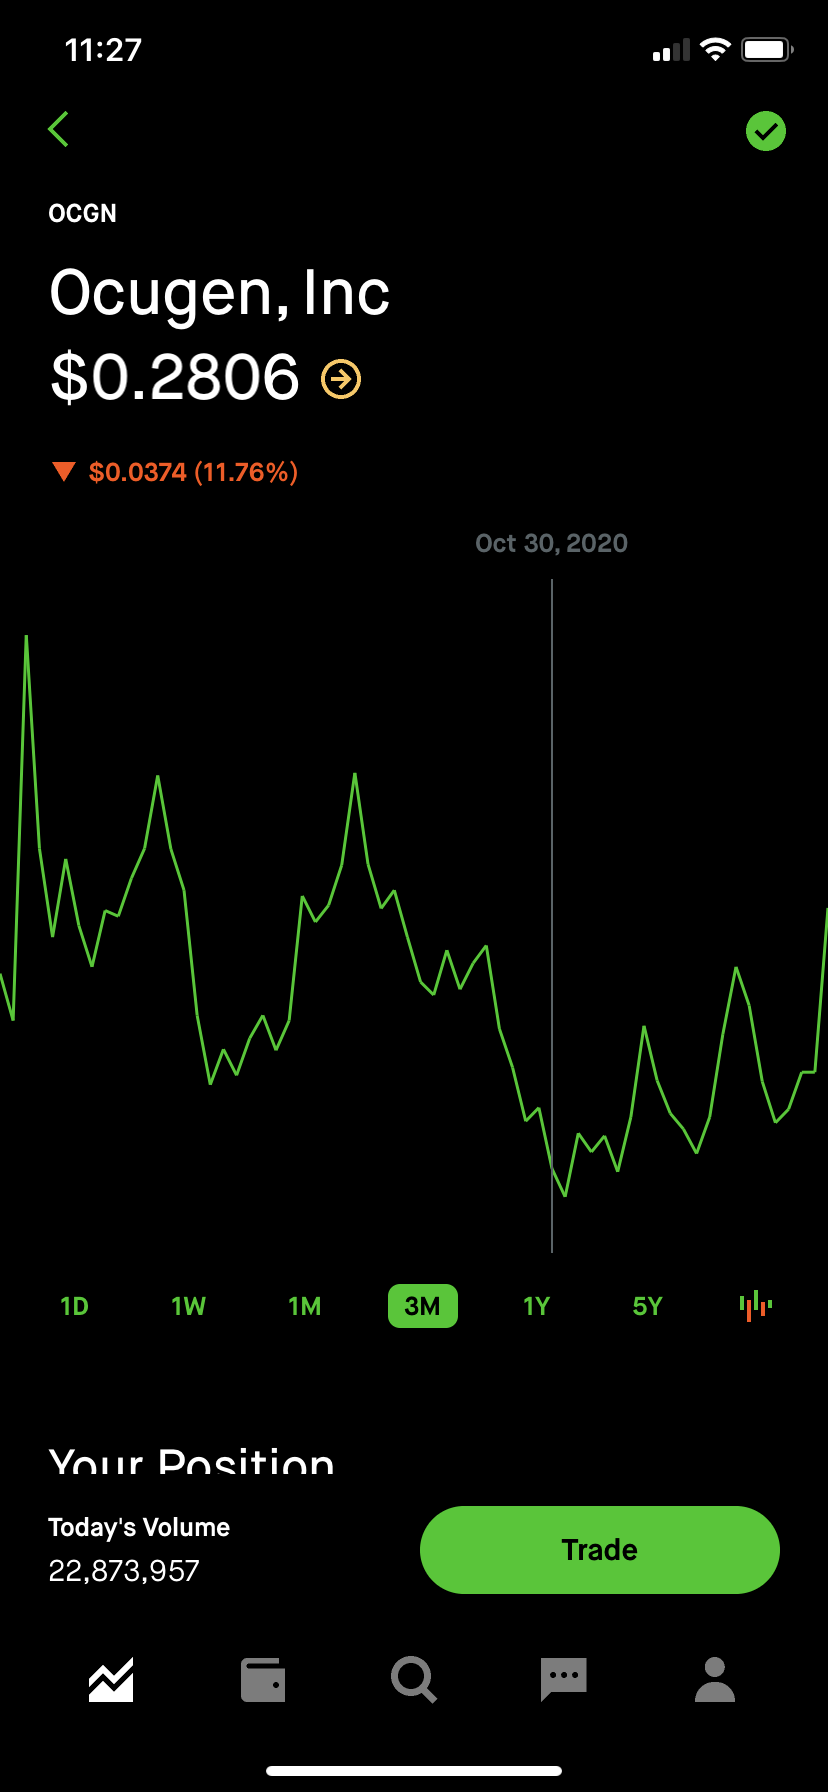
OCGN -Ocugen 11/30/2020
Stock Price Forecast
The 3 analysts offering 12-month price forecasts for Ocugen Inc have a median target of 1.00, with a high estimate of 1.00 and a low estimate of 0.70. The median estimate represents a +204.41% increase from the last price of 0.33.


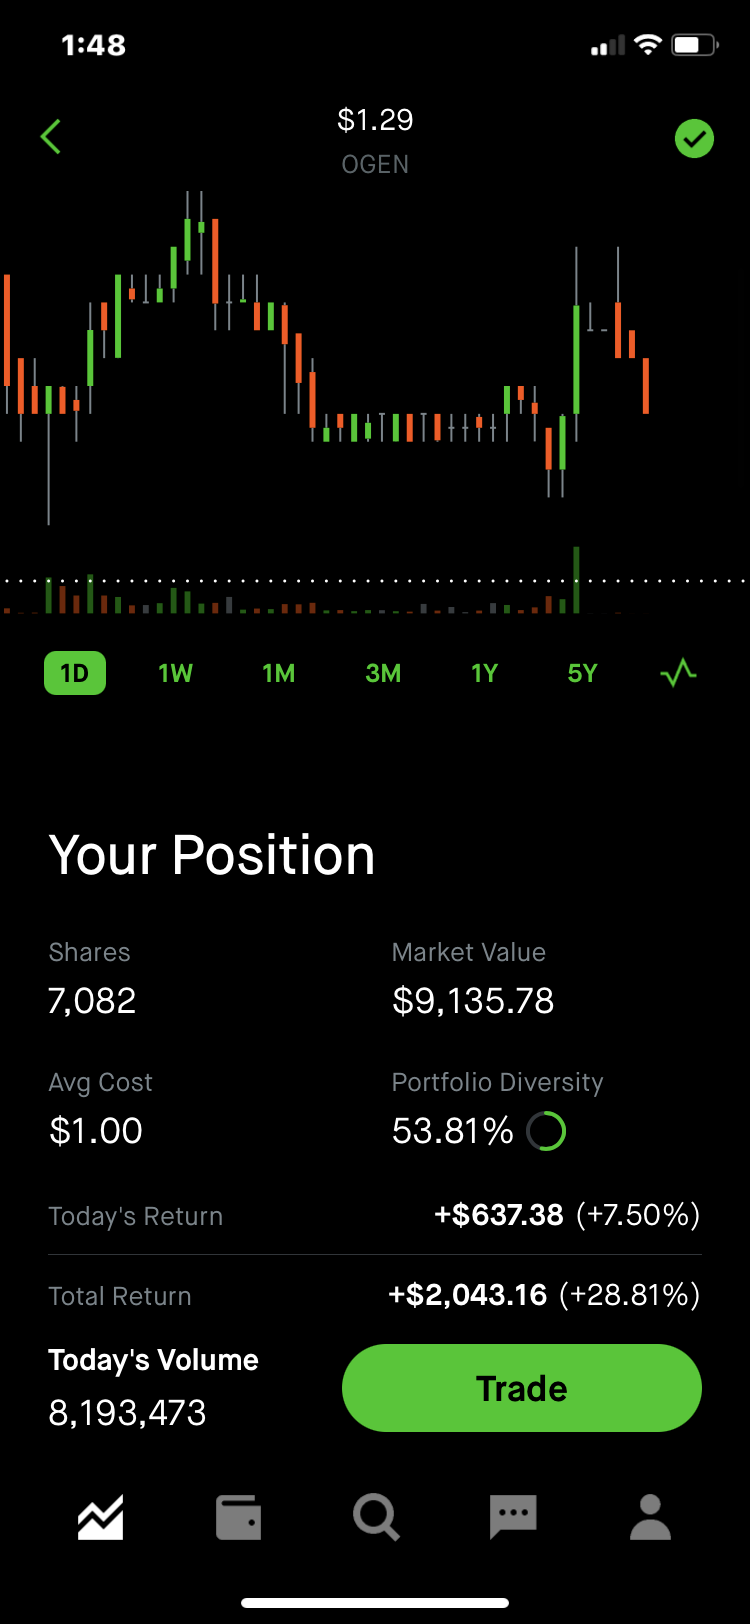
OGEN (FILL THE SHORT) POTENTIAL (TD) can exit
As of today OGEN 02/19/2021 OPEN AT 1.26 HIGHEST 1.34 LOWEST AT 1.22 VOLUME 8.19M MARKET CAP 128.54


Oragenics Inc (NYSE American:OGEN)
The 1 analysts offering 12-month price forecasts
for Oragenics Inc have a median target of 2.50, with a high estimate of
2.50 and a low estimate of 2.50. If you are looking for stocks with good return, Oragenics, Inc. stock can be a bad, high-risk 1-year investment option.
Oragenics, Inc. real time quote is equal to 0.394 USD at 2020-11-27, but your current investment may be devalued in the future.
The median estimate represents a
+509.76% increase from the last price of 0.41.
| ID | STOCK | Field3 | PRICES | AMOUNT | Field1 | number | fill prices | fill dollar | total filled | total unit | average | NET LOSS | Field2 | REMARK |
|---|---|---|---|---|---|---|---|---|---|---|---|---|---|---|
| 140 | OGEN | $0.71 | 3391 | $2,407.61 | 6000 | $0.42 | $2,520.00 | $4,927.61 | 9391 | $0.52 | 0 | 4CENT GAP |

CIDM FILL THE SHORT
| ID | STOCK | Field3 | PRICES | AMOUNT | Field1 | number | fill prices | fill dollar | total filled | total unit | average | NET LOSS | Field2 | REMARK |
|---|---|---|---|---|---|---|---|---|---|---|---|---|---|---|
| 160 | CIDM | RH | $1.17 | 936 | $1,095.12 | 18000 | $0.52 | $9,399.60 | $10,494.72 | 18936 | $0.55 | 0 |
| ID | STOCK | Field3 | PRICES | AMOUNT | Field1 | number | fill prices | fill dollar | total filled | total unit | average | NET LOSS | Field2 | REMARK |
|---|---|---|---|---|---|---|---|---|---|---|---|---|---|---|
| 161 | CIDM | $1.17 | 936 | $1,095.12 | 2000 | $0.52 | $1,040.00 | $2,135.12 | 2936 | $0.73 | 0 | 21CENT GAP X 2936 SH | 616.56 NET LOSS | |
| 162 | CIDM | $0.73 | 2936 | $2,143.28 | 2000 | $0.52 | $1,040.00 | $3,183.28 | 4936 | $0.64 | 0 | 12 CENT GAP X 4936 | 592 NET LOSS | |
| 163 | CIDM | $0.64 | 4936 | $3,159.04 | 2000 | $0.52 | $1,040.00 | $4,199.04 | 6936 | $0.61 | 0 | 9 CENT GAP |
| ID | STOCK | Field3 | PRICES | AMOUNT | total cost |
fill number | fill prices | fill dollar | total filled | total unit | average | NET LOSS | Field2 | REMARK |
|---|---|---|---|---|---|---|---|---|---|---|---|---|---|---|
| 147 | CIDM | $1.22 | 2400 | $2,928.00 | 2000 | $0.54 | $1,080.00 | $4,008.00 | 4400 | $0.91 | 0 | |||
| 148 | CIDM | $1.22 | 2400 | $2,928.00 | 4000 | $0.54 | $2,160.00 | $5,088.00 | 6400 | $0.80 | 0 | |||
| 149 | CIDM | $1.22 | 2400 | $2,928.00 | 6000 | $0.54 | $3,240.00 | $6,168.00 | 8400 | $0.73 | 0 | |||
| 150 | CIDM | $1.22 | 2400 | $2,928.00 | 8000 | $0.54 | $4,320.00 | $7,248.00 | 10400 | $0.70 | 0 | |||
| 151 | CIDM | $1.22 | 2400 | $2,928.00 | 10000 | $0.54 | $5,400.00 | $8,328.00 | 12400 | $0.67 | 0 | |||
| 152 | CIDM | $1.22 | 2400 | $2,928.00 | 12000 | $0.54 | $6,480.00 | $9,408.00 | 14400 | $0.65 | 0 | |||
| 153 | CIDM | $1.22 | 2400 | $2,928.00 | 14000 | $0.54 | $7,560.00 | $10,488.00 | 16400 | $0.64 | 0 | 10 cent |
net loss 1640 |
|
| 154 | CIDM | $1.22 | 2400 | $2,928.00 | 16000 | $0.54 | $8,640.00 | $11,568.00 | 18400 | $0.63 | 0 | 9cent |
net loss 1656 |
|
| 155 | CIDM | $1.22 | 2400 | $2,928.00 | 18000 | $0.54 | $9,720.00 | $12,648.00 | 20400 | $0.62 | 0 | 8cent |
Net loss 1632 |
|
| 156 | CIDM | $1.22 | 2400 | $2,928.00 | 20000 | $0.54 | $10,800.00 | $13,728.00 | 22400 | $0.61 | 0 | 7cent |
net lost 1568 |
|
| 157 | CIDM | $1.22 | 2400 | $2,928.00 | 22000 | $0.54 | $11,880.00 | $14,808.00 | 24400 | $0.61 | 0 | 7cent |
||
| 158 | CID |
$1.22 | 2400 | $2,928.00 | 24000 | $0.54 | $12,960.00 | $15,888.00 | 26400 | $0.60 | 0 | SHORT 6CENT |
NET loss 1584 |
| ID | STOCK | Field3 | PRICES | AMOUNT | Field1 | number | fill prices | fill dollar | total filled | total unit | average | NET LOSS | Field2 | REMARK |
|---|---|---|---|---|---|---|---|---|---|---|---|---|---|---|
| 159 | CEI | 4.50% DOWN | $0.96 | 100 | $95.80 | 1000 | $0.86 | $855.00 | $950.80 | 1100 | $0.86 | 0 |

HJLI
| ID | STOCK | Field3 | PRICES | AMOUNT | Field1 | number | fill prices | fill dollar | total filled | total unit | average | NET LOSS | Field2 | REMARK |
|---|---|---|---|---|---|---|---|---|---|---|---|---|---|---|
| 131 | HJLI | RH | $7.93 | 4 | $31.72 | 200 | $7.23 | $1,446.00 | $1,477.72 | 204 | $7.24 | 0 |
OGI trade
The 9 analysts offering 12-month price forecasts for OrganiGram Holdings Inc have a median target of 1.91, with a high estimate of 4.06 and a low estimate of 1.33.
The median estimate represents a +43.59% increase from the last price of 1.33.
| ID | Field1 | TIME | STOCK | CURRENCY | NUMBER | Field3 | SELL AMT | SELL PRICES | SELL TOTAL | gain | highest |
remark | Field6 | Field7 |
|---|---|---|---|---|---|---|---|---|---|---|---|---|---|---|
| 12 | 11/30/2020 | 10:23:00 AM | OGI | $1.22 | 1000 | $1,220.00 | 1000 | $1.43 | $1,430.00 | $210.00 | highest 1.43 | report date | vol 22:11M | market cap 319M |


OGI news
| |
OrganiGram Holdings Inc. CEO Greg Engel on Q4 2020 Results -- Earnings Call Transcript >OGI
11/30/20 2:09 PM ET (Dow Jones)Print
From Seeking Alpha: OrganiGram Holdings Inc. CEO Greg Engel on Q4 2020 Results -- Earnings Call Transcript https://seekingalpha.com/article/4392114-organigram-holdings-inc-ogi-ceo-greg-engel-on-q4-2020-results-earnings-call-transcript?utm_source=dowjonesnewswire.com&utm_medium=referral
(END) Dow Jones Newswires

The 9 analysts offering 12-month price forecasts for OrganiGram Holdings Inc have a median target of 1.91, with a high estimate of 4.06 and a low estimate of 1.33. The median estimate represents a +43.59% increase from the last price of 1.33.


Subscribe to:
Posts (Atom)