Blog Archive

Friday, December 30, 2022

New Fed research flags rising risk of U.S. recession

Just over half of the 50 U.S. states are exhibiting signs of slowing economic activity, breaching a key threshold that often signals a recession is in the offing, new research from the St. Louis Federal Reserve Bank report said.

That report, released Wednesday, followed another report from the San Francisco Fed from earlier in the week that also delved into the rising prospect that the U.S. economy may fall into recession at some point in coming months.

The St. Louis Fed said in its report that if 26 states have falling activity within their borders, that offers "reasonable confidence" that the nation as a whole will fall into a recession.

Right now, the bank said that as measured by Philadelphia Fed data tracking the performance of individual states, 27 had declining activity in October. That's enough to point to a looming downturn while standing short of the numbers that have been seen ahead of some other recessions. The authors noted that 35 states suffered declines ahead of the short and sharp recession seen in the spring of 2020, for example.

Meanwhile, a San Francisco Fed report, released Tuesday, observed that changes in the unemployment rate can also signal a downturn is on the way, in a signal that offers more near-term predictive value than the closely-watched bond market yield curve.

The paper's authors said that the unemployment rate bottoms out and begins to move higher ahead of recession in a highly reliable pattern. When this shift occurs the unemployment rate is signaling the onset of recession in about eight months, the paper said.

The paper acknowledged its findings are akin to those of the Sahm Rule, named for former Fed economist Claudia Sahm, who pioneered work linking a rise in the jobless rate to economic downturns. The San Francisco Fed research, written by bank economist Thomas Mertens, said its innovation is to make the jobless rate change a forward-looking indicator.

Unlike the St. Louis Fed state data that is tipping toward a recession projection, the U.S. jobless rate has thus far remained fairly stable, and after bottoming at 3.5% in September, it held at 3.7% in both October and November.

The San Francisco Fed paper noted that the Fed, as of its December forecasts, sees the unemployment rate rising next year amid its campaign of aggressive rate hikes aimed at cooling high levels of inflation. In 2023, the Fed sees the jobless rate jumping up to 4.6% in a year where it sees only modest levels of overall growth.

If the Fed's forecast comes to pass, "such an increase would trigger a recession prediction based on the unemployment rate," the paper said. "Under this view, low unemployment can lead to a heightened probability of recession when the unemployment rate is expected to rise."

Tim Duy, chief economist with SGH Macro Advisors, said he believes that to achieve what the Fed wants on the inflation front, the economy would likely "lose roughly two million jobs, which would be a recession like 1991 or 2001."

Anxiety over the prospect of the economy falling into recession has been driven by the Fed's forceful actions on inflation. Many critics contend that the central bank is focusing too much on inflation and not enough on keeping Americans employed. Central bank officials have countered that without a return to price stability, the economy will struggle to meet its full potential.

What's more, in the press conference following the most recent Federal Open Market Committee meeting earlier this month, central bank leader Jerome Powell said that he didn't view the current Fed outlook as a recession prediction given the expectation growth will remain positive. But he added much remains uncertain.

"I don't think anyone knows whether we're going to have a recession or not and, if we do, whether it's going to be a deep one or not. It's just, it's not knowable," Powell said.


 (Reporting by Michael S. Derby; Editing by Dan Burns and Aurora Ellis)


UAVS as of 12/30 /2022


 My stock market value

Your market value

$32.00

Today‘s return
+$0.42 (+1.33%)
Total return
-$219.41 (-87.27%)
Your average cost2.51

Shares        100

Portfolio diversity
0.86%


AgEagle Aerial Systems, Inc. engages in the design and manufacture of drones for commercial use. The firm also enables the capturing, imaging, editing, and analyzing of images and data captured by drones and intends on using commercial drones to be used for delivery services of goods. It offers contract manufacturing, drone solutions, and agriculture solutions. The company was founded on March 31, 1999 and is headquartered in Wichita, KS (. The listed name for UAVS is AgEagle Aerial Systems, Inc.

City Hall Wichita, Kansas 


  AgEagle Aerial Systems stock split history picture
AgEagle Aerial Systems (UAVS) has 1 split in our AgEagle Aerial Systems stock split history database. The split for UAVS took place on March 27, 2018. This was a 1 for 25 reverse split, meaning for each 25 shares of UAVS owned pre-split, the shareholder now owned 1 share. For example, a 1000 share position pre-split, became a 40 share position following the split.

When a company such as AgEagle Aerial Systems conducts a reverse share split, it is usually because shares have fallen to a lower per-share pricepoint than the company would like. This can be important because, for example, certain types of mutual funds might have a limit governing which stocks they may buy, based upon per-share price. The $5 and $10 pricepoints tend to be important in this regard. Stock exchanges also tend to look at per-share price, setting a lower limit for listing eligibility. So when a company does a reverse split, it is looking mathematically at the market capitalization before and after the reverse split takes place, and concluding that if the market capitilization remains stable, the reduced share count should result in a higher price per share. 

Looking at the AgEagle Aerial Systems stock split history from start to finish, an original position size of 1000 shares would have turned into 40 today. Below, we examine the compound annual growth rate — CAGR for short — of an investment into AgEagle Aerial Systems shares, starting with a $10,000 purchase of UAVS, presented on a split-history-adjusted basis factoring in the complete AgEagle Aerial Systems stock split history. 

  • Start date:     01/02/2013     

  • End date:     12/29/2022     

  • Start price/share:     $12.50     

  • End price/share:     $0.32     

  • Dividends collected/share:     $0.00     

  • Total return:     -97.44%     

  • Average Annual Total Return:     -30.70%     

  • Starting investment:     $10,000.00     

  • Ending investment:     $255.98     

  • Years:     9.99    


IDEX reverse split compare 1 week 1 month 3 month 1 year to invest long term to check financial


Market cap as  of 4/4/2024
11.81M
Price-Earnings ratio
-0.02
Dividend yield
Average volume
507.12K
High today
$1.05
Low today
$0.9753
Open price
$1.00
Volume
296.89K
52 Week high
$16.13
52 Week low
$0.88

The average Ideanomics stock price prediction forecasts a potential upside of 1,204.35% from the current IDEX share price of $0.23. 
 

  • Ideanomics (IDEX): Forward revenue estimates point to a robust future ahead for the business

 
 The 1 analysts offering 12-month price forecasts for Ideanomics Inc have a median target of 1.00, with a high estimate of 1.00 and a low estimate of 1.00. The median estimate represents a +586.34% increase from the last price of 0.15. 
 
Ideanomics (NASDAQ: IDEX), a global company focused on accelerating the commercial adoption of electric vehicles (EV), today announces that its subsidiary Energica now has 24 certified dealers in the United States, which accounts for 33% of product sales.

02/06/2023 Ideanomics Inc (IDEX) stock has fallen -82.35% over the last 12 months, and the average rating from Wall Street analysts is a Hold. InvestorsObserver’s proprietary ranking system, gives IDEX stock a score of 34 out of a possible 100.


What this means: InvestorsObserver gives Ideanomics Inc (IDEX) an overall rank of 34, which is below average. Ideanomics Inc is in the bottom half of stocks based on the fundamental outlook for the stock and an analysis of the stock's chart. A rank of 34 means that 66% of stocks appear more favorable to our system.

Who this matters to: Overall Ranking is a comprehensive evaluation. It considers technical and fundamental factors and is a good starting point for evaluating a stock.


  • Ideanomics (IDEX): Forward revenue estimates point to a robust future ahead for the business

Ideanomics Inc (IDEX) Analyst Forecast

Next 12 months ➝Current Price$0.1752-week High$1.1552-week Low$0.14FORECAST$1.00+480.72%

IDEX Price, Volume, Earnings, and Dividend Date

  • Last Price$0.17
  • Previous Close$0.17
  • Change$0.00
  • Open$0.19
  • Volume22,413,560
  • Avg. Volume (100-day)9,949,718
  • Market Cap101,503,787
  • Days Range0.1722 - 0.1853
  • 52-week Range0.14 - 1.15
  • Dividend Yield
  • Ex. Dividend Date
  • P-E
  • EPS
  • Earnings Date02/07/23
  • SectorTechnology
  • IndustrySoftware - Application
  • Avg. Analyst Rec.Premium
  • Beta1.904
  • PEG Ratio


Proterra Inc. (PTRA)

ChargePoint Holdings (CHPT)


MULN as of 12/30/2022

 Mullen Automotive Inc is engaged in manufacturing electric vehicles and energy solutions. The company strives to make electric vehicles more accessible by building an end-to-end ecosystem that takes care of all aspects of electric vehicle ownership.

$0.2638
At close: Dec 29
$0.2533
-0.0105[-3.98%]
After Hours: 5:04AM EDT

Day Range- - -52 Wk Range0.180 - 5.860Open / Close- / -Float / Outstanding1.378B / 1.659B
Vol / Avg.951.676K / 192.627MMkt Cap437.670MP/E-50d Avg. Price0.290
Div / Yield (Forward)- / -%Payout Ratio-Total Float1.378BEPS-0.287   

Thursday, December 29, 2022

NXPL


ST
ID stock number price TOTAL PRICE plan current price NUMBER OF SHARE current lost price net loss fill amount filled price fill total grand total grand share grand avg GAP
21 NXPL-FILL $3.11 $1.55 $4.82
$1.39 $3.11 $4.32 ($0.50) $9.00 $1.39 $12.51 $17.33 $12.11 $1.43

SONIM SPLIT -FILL THE SHORT


ST
ID stock number price TOTAL PRICE plan current price NUMBER OF SHARE current lost price net loss fill amount filled price fill total grand total grand share grand avg GAP
19 SONIM-SPLIT $251.00 $0.42 $105.39
$0.00 $0.00 $0.00 ($105.39) $0.00 $0.00 $0.00 $105.39 $0.00


SPCE FILL THE SHORT


ST
ID stock number price TOTAL PRICE plan current price NUMBER OF SHARE current lost price net loss fill amount filled price fill total grand total grand share grand avg GAP
20 SPCE-FILL $4.11 $5.60 $23.02
$3.29 $4.11 $13.52 ($9.49) $12.00 $3.29 $39.48 $62.50 $16.11 $3.88

ST
ID stock number price TOTAL PRICE plan current price NUMBER OF SHARE current lost price net loss fill amount filled price fill total grand total grand share grand avg GAP
20 SPCE-FILL $4.11 $5.60 $23.02
$3.29 $4.11 $13.52 ($9.49) $100.00 $3.29 $329.00 $352.02 $104.11 $3.38


Wednesday, December 21, 2022

Fill the short calculation


Table1
ID stock number price Field1 plan current price share amount current lost price net loss fill amount filled price fill total grand total grand share grand avg
1 LIT $0.06 $73.17 $4.39
$62.56 $0.06 $3.75 ($0.64) $6.00 $62.56 $375.36 $379.75 $6.06 $62.67

Monday, November 21, 2022

ANY FILL THE SHORT

 95 % DOWN  

108 SHARE 

AVG 6.74 

PERCENTAGE ( - 94.88 %  ) 


1: 1000 SHARE 

100 x 10000 0.36 gap ( 5 to 6 cent  ) 

current 0.3268 to 0.34 cent

STOCK -FILL THE SHORT TABLE
ID STOCK REMARK PRICE BROKER DATE AND TIME PRICES AMOUNT Field1 number fill prices fill dollar total filled total unit average NET LOSS Field2 REMARK
306 ANY


$6.74 108 $727.92 10800 $0.33 $3,529.44 $4,257.36 10908 $0.39 0

STOCK -FILL THE SHORT TABLE
ID STOCK REMARK PRICE BROKER DATE AND TIME PRICES AMOUNT Field1 number fill prices fill dollar total filled total unit average NET LOSS Field2 REMARK
306 ANY


$0.74 108 $79.92 1080 $0.33 $352.94 $432.86 1188 $0.36 0

Friday, November 11, 2022

recent up stock

 Just look at this recent string of winners:

96% on Thermo Fisher Scn (TMO) 
92% with Costco (COST) 
108% from Invesco ETF (QQQ) 
59% off of Merck (MRK) 
12% with SPDR DJIA (DIA) 
58% on IBM (IBM)  
100% on AutoZone (AZO) 
100% with Eli Lilly (LLY) 
8% with Sea Limited (SE) 
100% on Archer Daniels (ADM) 
28% from Illinois Tool Works (ITW) 
112% on Western Digital (WDC) 

Wednesday, November 9, 2022

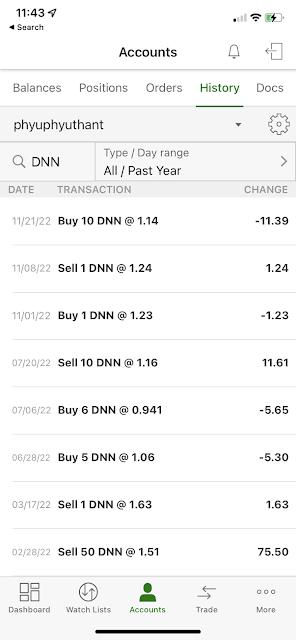
DNN


3 Climate Change Penny Stocks That Will Make You Rich in 5 Years

DNN
+3.0075%
SUNW
-6.7961%
GEVO
-1.4634%

Investing in climate change penny stocks has never been a better opportunity than now.  

The prevalence of green energy has become ubiquitous over time, and savvy investors looking to invest in the future of sustainability will benefit immensely. With a well-rounded portfolio, these investments could be incredibly valuable in the coming years.

Furthermore, research suggests that the renewable energy space will continue to accelerate each year. For instance, The U.S. grid operated more than three times the installed solar photovoltaic capacity after last year compared to 2017. Moreover, installed capacity could grow by a whopping 84% in two years.  

Therefore, the potential of investing in the sector is massive, and investing in penny stocks will enable investors to gain exposure without breaking the bank.

Ticker

Company

Price

SUNW

Sunworks

$2.24

DNN

Denison Mines

$1.40

GEVO

Gevo

$2.10


The 7 Most Promising Penny Stocks to Buy in February


    In this article:


    RLX
    +0.2294%


  • AMWL
    -2.71%


  • UEC
    +5.2770%


  • DNN
    +3.01%


  • BTG
    -3.8158%

    Before discussing the most promising penny stocks to buy, it’s important to broadcast a fundamental disclaimer: this sector is wildly risky. As an investor, you want to make sure the bulk of your money goes toward higher-probability names. And prior to that, your finances should address core needs first before engaging the capital markets. Once checking off these items, I suppose you can throw some loose change toward speculative ventures.

    Still, even with the best precautions, the most promising penny stocks to buy present incredible dangers to your portfolio. Therefore, to formulate this list, I focused on securities priced no higher than $5 that trade in major exchanges. In addition, all of these ideas feature at least a consensus moderate buy rating from Wall Street analysts.

    To be sure, approval from smart folks doesn’t guarantee a thing. Nevertheless, if you have your mind set on the most promising penny stocks to buy, you might as well trade with the pros. Below are compelling (but risky) names to consider.


    ANGI

     share  12.01   market   2.25  AVG 2.32 (2.95 ) % down  today 0.88%  purchase date  04 April 2024 2.34 3 April 2024 2.48 4 April 2024 2.30

    Labels